Data collection in quantitative research includes surveys and questionnaires, experiments, observational studies, secondary data analysis and structured interviews. Surveys gather numerical data through predefined questions, while experiments manipulate variables to observe effects. Observational studies collect data by watching subjects in natural settings and secondary data analysis involves using pre-existing data sources such as government reports. Structured interviews use consistent questions for detailed responses. Each method offers unique strengths, such as control in experiments or real-world insights in observational studies, with the choice depending on the research objectives and constraints.
- Types of data collection methods in quantitative research
- Data collection in quantitative research vs in qualitative research
- Analysing quantitative research data
- Structure of a data collection section in quantitative research text
- Sample data collection section in a quantitative research text
- Using professional editing services to polish a quantitative research text
What are data collection methods in quantitative research?
In quantitative research, data collection methods focus on gathering numerical data that can be measured, analysed statistically and used to draw conclusions. Common methods include:
Surveys and questionnaires
Participants answer predefined questions, typically using scales (e.g. Likert) or multiple-choice formats. Surveys and questionnaires are widely used for large samples to gather data on opinions, behaviours or characteristics. This method is cost-effective and easy to administer to large populations. However, its challenges include response biases and low response rates that can affect data quality.
To collect data using surveys or questionnaires:
- distribute surveys with structured, closed-ended questions (e.g. multiple-choice, rating scales).
- use tools like Google Forms or SurveyMonkey to collect data online or conduct paper-based surveys.
- ensure questions are clear and measurable to capture numerical data from a large sample.
Experiments
To carry out experiments, researchers manipulate one or more variables (independent variables) to observe the effect on another variable (dependent variable). Experiments are common in controlled environments (e.g. labs) to establish causal relationships. Their advantages include high control over variables, which allows for clearer cause-and-effect conclusions. However, experiments may lack real-world applicability (external validity).
To collect quantitative data from experiments:
- set up controlled experiments where you manipulate independent variables and measure their effects on dependent variables.
- use pre- and post-tests, measurements or sensor data to quantify the outcomes.
- randomly assign participants to control and experimental groups to ensure reliable data.
Observational studies
Observational studies involve data collection by observing subjects in a natural or controlled environment without intervention. They are often used when direct manipulation is impossible or unethical, such as in field studies. On the plus side, they provide real-world insights and data on behaviour in natural settings. However, they may lack control over variables, which can lead to less precise results.
To collect quantitative data via observational studies:
- use structured observation tools or checklists to systematically record specific behaviours or events in natural or controlled settings.
- convert observations into numerical data, such as frequency counts or time-based measures (e.g. the number of times a behaviour occurs).
Secondary data analysis
In secondary analysis, researchers analyse existing data collected by others (e.g. government reports, census data). This type of analysis is useful when primary data collection is impractical or costly. Its pros include saving time and resources and working with large, reliable sources. However, there may be limited control over how the data was originally collected; moreover, potential for outdated or irrelevant data.
To collect data by using secondary data analysis:
- analyse existing datasets (e.g. government statistics, business records, census data) that provide numeric data relevant to your research question.
- this method is useful when primary data collection is costly or impractical.
Structured interviews
In structured interviews, researchers ask the same set of predefined questions to participants, often in a face-to-face or phone format. They are used to gather in-depth responses while maintaining comparability across participants. Structured interviews provide more detailed, consistent data than open-ended interviews. But they may be time-consuming and may limit flexibility in exploring unanticipated insights.
Finally, to collect quantitative data from structured interviews:
- conduct interviews with a set of predefined, closed-ended questions that can be quantified.
- record responses in numeric form (e.g. binary yes/no answers or ratings on a scale).
What is the difference between data collection in quantitative research and qualitative research?
The main difference between data collection in quantitative and qualitative research lies in the nature of the data and the methods used.
Quantitative research focuses on collecting numerical data that can be measured and statistically analysed. Common methods include surveys, experiments and structured observations. The data is typically objective and aims to quantify variables, relationships and patterns.
Qualitative research focuses on collecting non-numerical data, such as words, behaviours or images, to explore deeper meanings, experiences and perspectives. Qualitative methods include interviews, focus groups and participant observation. The data is subjective and rich in context, aiming for in-depth understanding rather than statistical generalisation.
How to analyse quantitative data?
Analysing quantitative data involves several steps to ensure an accurate interpretation of the results. Here is a concise guide on how to approach it:
1. Data preparation
- Clean the data: Check for missing values, outliers or inconsistencies and handle them appropriately (e.g. removal, imputation).
- Organise data: Enter data into a structured format, like spreadsheets (e.g. Excel) or statistical software (e.g. IBM SPSS, R, Python).
2. Descriptive statistics
- Summarise data: Use basic statistics such as mean (average), median (middle value), mode (most frequent value) and standard deviation (measure of variability).
- Visualise data: Create charts (e.g. histograms, bar charts or pie charts) to understand distributions and trends.
3. Inferential statistics
- Test hypotheses: Use statistical tests to draw conclusions about the population from your sample data, such as t-tests (comparing means between two groups), ANOVA (comparing means across multiple groups), chi-square test (testing associations between categorical variables) and regression analysis (predicting relationships between variables)
- P-values: Check if results are statistically significant, typically using a threshold of 0.05.
4. Correlation and regression analysis
- Correlation: Measure the strength and direction of relationships between variables (e.g. Pearson correlation).
- Regression: Identify the impact of one or more independent variables on a dependent variable (e.g. linear or multiple regression).
5. Interpret results
- Analyse what the statistical outcomes mean in relation to your research question.
- Look for patterns, trends or relationships and assess whether the findings support your hypotheses.
6. Report findings
- Present the results clearly using tables, graphs and a written explanation of your findings.
- Highlight key statistics, significant relationships or trends revealed in your data analysis.
Using appropriate software tools (e.g. Excel, IBM SPSS, R, Python) can help automate many of these steps and ensure the accuracy of your analysis.
In an academic text, where does the data collection section fit in?
In an academic text such as a thesis, monograph or research article, the data collection section typically fits within the methodology or methods chapter or section. This section follows the literature review and precedes the data analysis or findings/results section. It provides a detailed explanation of how the researcher(s) gathered the data, ensuring transparency and replicability. Specifically, the methodology section includes research design, sampling strategy, data collection methods and ethical considerations, among other components.
How to structure a quantitative data collection section in an academic text?
In an academic text (monograph, research article, thesis), the data collection section is crucial as it explains how the data was gathered. It should be structured clearly and logically to ensure transparency and replicability. Here is how to structure it, with key components:
1. Introduction to data collection
- Purpose: Briefly introduce the importance of this section and link it to your research objectives or hypotheses.
- Overview: Provide a general overview of how and why the chosen data collection methods were selected.
2. Research design
- Study type: Explain whether the research is experimental, observational, survey-based, etc.
- Justification: Justify why this design suits your research objectives.
3. Sampling strategy
- Population: Describe the population or subjects under study, including any specific inclusion or exclusion criteria.
- Sampling method: Detail the sampling method used (e.g. random sampling, stratified sampling, convenience sampling) and explain why it was appropriate for your study.
- Sample size: Specify the sample size and explain how it was determined (e.g. using power analysis, previous studies).
- Sampling frame: Describe the procedure for selecting participants or units of analysis from the population.
4. Data collection methods
- Description of methods: Outline the methods used to collect data, such as surveys, interviews, observations or experiments.
- Instrumentation: Provide details about the tools or instruments used (e.g. survey questionnaires, interview guides, sensors, lab equipment), including their development, validation and reliability.
- Data collection process: Explain how the data was gathered step-by-step, specifying the time frame, locations or platforms (if online) and the role of any data collectors.
- Pilot testing (if applicable): Mention any pilot studies or pre-tests conducted to refine data collection instruments and explain any adjustments made.
5. Ethical considerations
- Informed consent: Explain how informed consent was obtained from participants.
- Confidentiality: Describe measures to protect the privacy and confidentiality of participants.
- Approval: Mention any institutional ethics approval obtained (e.g. from an ethics review board).
6. Data quality and reliability
- Validity: Address how the methods ensure the validity (accuracy) of the data collected.
- Reliability: Discuss the reliability (consistency) of the data collection instruments or methods.
- Bias mitigation: Outline steps taken to minimise bias, including researcher or participant bias.
7. Challenges and limitations
- Practical Issues: Discuss any challenges encountered during data collection (e.g. non-response, access issues) and how they were addressed.
- Limitations: Highlight any limitations of your data collection process that may affect the generalisability or accuracy of the results.
8. Conclusion/transition
- Summarise the data collection process and link it to the upcoming sections on data analysis or results.
Example outline of a data collection section
- Introduction to data collection
- Research design
- Sampling strategy
- Data collection methods
- Instruments
- Process
- Ethical considerations
- Data quality and reliability
- Challenges and limitations
- Conclusion/transition
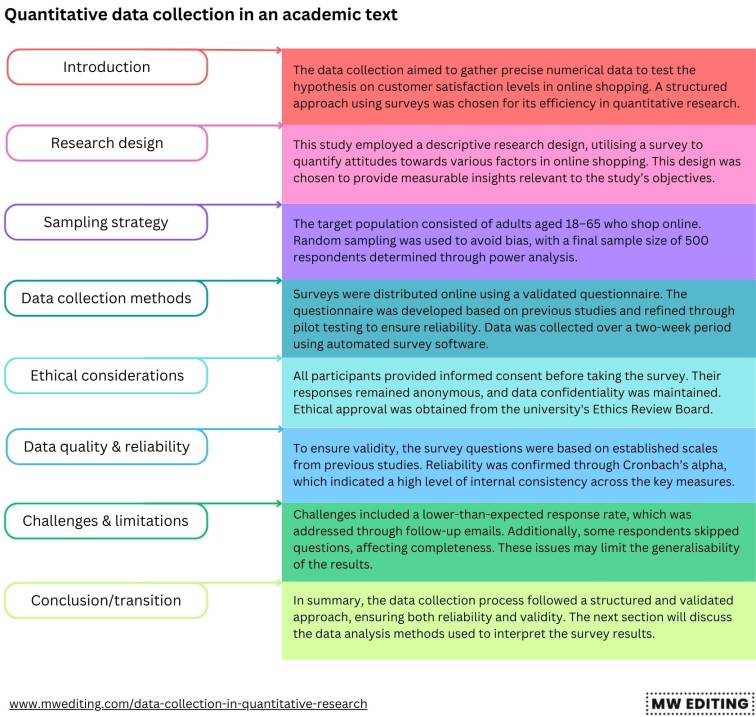
Sample quantitative data collection section
The data collection aimed to gather precise numerical data to test the hypothesis on customer satisfaction levels in online shopping. A structured approach using surveys was chosen for its efficiency in quantitative research.
This study employed a descriptive research design, utilising a survey to quantify attitudes towards various factors in online shopping. This design was chosen to provide measurable insights relevant to the study’s objectives.
The target population consisted of adults aged 18–65 who shop online. Random sampling was used to avoid bias, with a final sample size of 500 respondents determined through power analysis.
Surveys were distributed online using a validated questionnaire. The questionnaire was developed based on previous studies and refined through pilot testing to ensure reliability. Data was collected over a two-week period using automated survey software.
All participants provided informed consent before taking the survey. Their responses remained anonymous and data confidentiality was maintained. Ethical approval was obtained from the university’s Ethics Review Board.
To ensure validity, the survey questions were based on established scales from previous studies. Reliability was confirmed through Cronbach’s alpha, which indicated a high level of internal consistency across the key measures.
Challenges included a lower-than-expected response rate, which was addressed through follow-up emails. Additionally, some respondents skipped questions, affecting completeness. These issues may limit the generalisability of the results.
In summary, the data collection process followed a structured and validated approach, ensuring both reliability and validity. The next section will discuss the data analysis methods used to interpret the survey results.
How can professional editing services help prepare quantitative research text for publication?
Professional editing services can significantly improve the quality and readiness of a quantitative research text for publication by focusing on several key areas:
- Clarity and coherence: Developmental editors ensure that your arguments are clearly presented and logically structured. They help eliminate ambiguity, ensuring that complex ideas are easy to follow for readers.
- Language and style: Professional copyeditors refine your language, improving grammar, punctuation, syntax and flow. They also adjust the text to meet the formal tone and style required for academic writing.
- Consistency: Copyeditors check for consistency in terminology, citation style, formatting and section headings. This includes ensuring consistent use of technical terms, abbreviations and figures throughout the document.
- Formatting and compliance with guidelines: Copyeditors ensure that your manuscript adheres to the specific formatting and citation requirements of the target journal, publisher or academic institution, such as APA, MLA or Chicago style.
- Reducing redundancy: Line editors help trim unnecessary repetition, streamline sentences and ensure the text remains concise without sacrificing depth or clarity.
- Improving readability: Copyeditors work on improving the overall readability of the text, making it more accessible to a wider audience while maintaining academic rigour.
- Critical feedback: Developmental editors provide feedback on content, helping to identify weak arguments, gaps in research or areas that require further elaboration or clarification.
- Final proofreading: Professional proofreaders conduct a thorough final check for any minor errors (typos, misplaced commas, formatting issues) before submission, ensuring a polished and professional final manuscript.